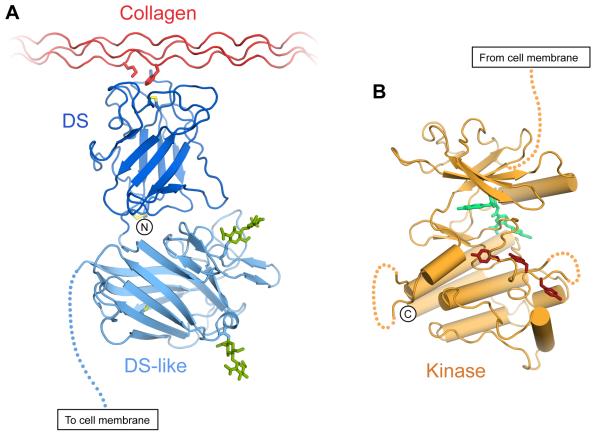
Figure 2.
Crystal structures of DDR1 globular domains. (A) Cartoon drawing of most of the DDR1 ectodomain bound to collagen, represented by a composite of the DDR2 DS domain bound to a collagen-like peptide (Carafoli et al., 2009) and the structure of the DS and DS-like domain of DDR1 (Carafoli et al., 2012). The side chains of key collagen residues (Met21 of the leading chain, Phe23 of the middle chain) are shown. Disulphide bonds are depicted in yellow. N-linked glycans in the DS-like domain are shown in green. The DDR1 N-terminus is indicated. The dashed line represents the extracellular JM region. (B) Structure of the DDR1 kinase domain in complex with type II inhibitor DDR1-IN-1 (Kim et al., 2013). The inhibitor is depicted in green, tyrosine residues of the activation loop (Tyr792, Tyr796 and Tyr797; DDR1b numbering) are shown in brown. Dashed lines represent loop regions with poor electron density. The dashed line towards the top of the Figure represents the cytoplasmic JM region. The DDR1 C-terminus (Val913) is indicated. The Figure was prepared using the coordinates of PDB entries 2WUH (Carafoli et al., 2009), 4AG4 (Carafoli et al., 2012) and 4BKI (Kim et al., 2013).

