
Figure 3.
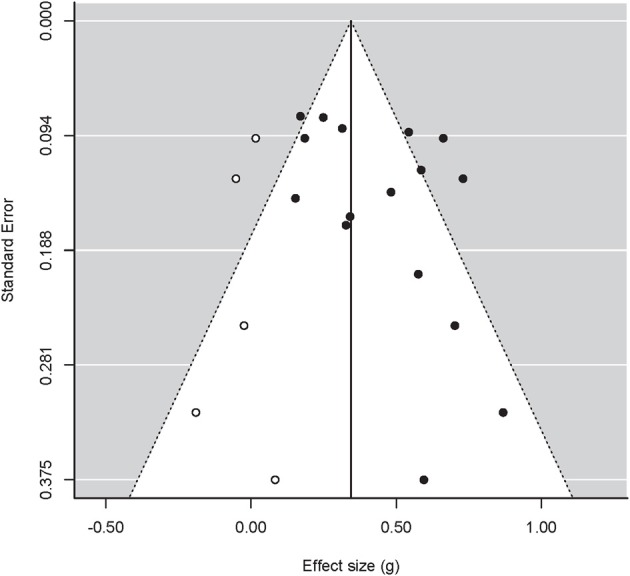
Funnel plot for studies concerning both affects combined, with treatment effects on the x-axis and the standard error on the y-axis. Closed circles are original data, open circles represent filled-in data based on the trim-and-fill method. Dotted lines represent 95% confidence interval around the mean.