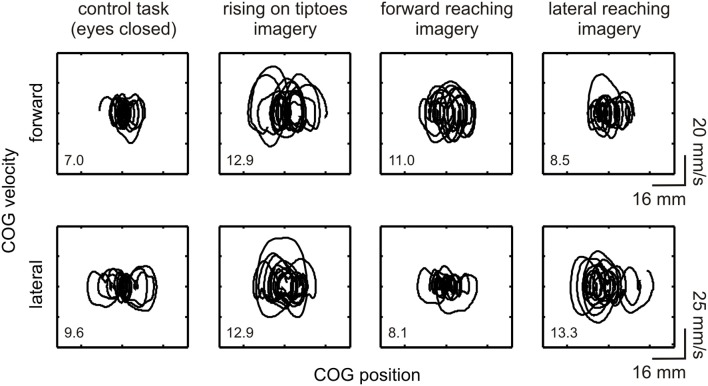
Figure 2.
Effect of motor imagery on COG variability. COG phase-plane plots from a representative subject (#11) are shown during control and imagery tasks (as indicated under each column). Plots are shown for the forward-backward (indicated as “forward,” upper plots) and lateral (lower plots) directions. Correspondent directional stability values (DSFWB and DSLAT) are presented as an inset. Large COG variability was observed in the forward-backward direction during the rising on tiptoes and forward reaching imagery tasks; conversely, changes in COG variability in the lateral direction occurred in the rising on tiptoes and lateral reaching imagery tasks.

