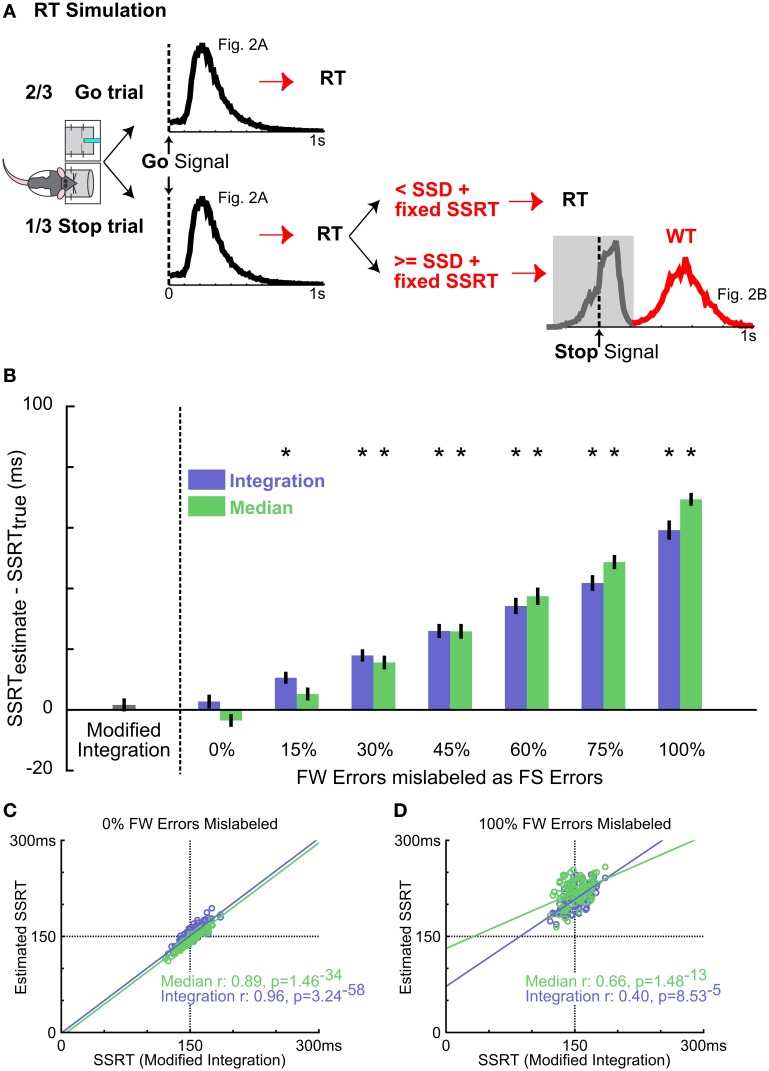
Figure 5.
Validating the new SSRT estimation method using simulated data. (A) Schematic of the RT simulation. Each of the 100 simulation runs consisted of 300 Go trials and 150 Stop trials. RTs in Go trials were randomly drawn from the mean RT distribution from Figure 2A. Stop trials were modeled as an independent race between a go process (as in Go trials) and a stop process consisting of the SSD randomly drawn from 5 SSDs and a fixed SSRT at 150 ms. If the go process finished faster, RT was determined by the go process. If the stop process finished faster, the fast go response was inhibited and the WT was randomly drawn from the slow peak of the mean WT distribution from Figure 2B (red). This simulation produced RT and WT distributions similar to the empirical observation. (B) Summary of SSRT estimates (mean ± s.e.m) with varying amounts of FW errors mislabeled as FS errors for integration (blue) and median (green) methods, compared with SSRT estimated from the modified integration method. Conflation of FW errors as FS errors systematically overestimates SSRT using median and integration methods. Asterisks denote SSRT estimates significantly greater than the true SSRT (150 ms) by independent t-test Bonferroni corrected for multiple comparisons (n = 10.10-iteration blocks). (C) Scatter plot of estimated SSRTs over all model iterations between the modified integration method vs. the conventional median (green) and integration (blue) methods. For median and integration methods, the ideal WT cutoff (see Methods) was used to classify failed and successful stop trials. n = 100 iterations. (D) Scatter plot of SSRT estimates using the 500 ms WT cutoff, which mislabels all FW errors as FS errors. Convention as in (C) n = 100 iterations.

