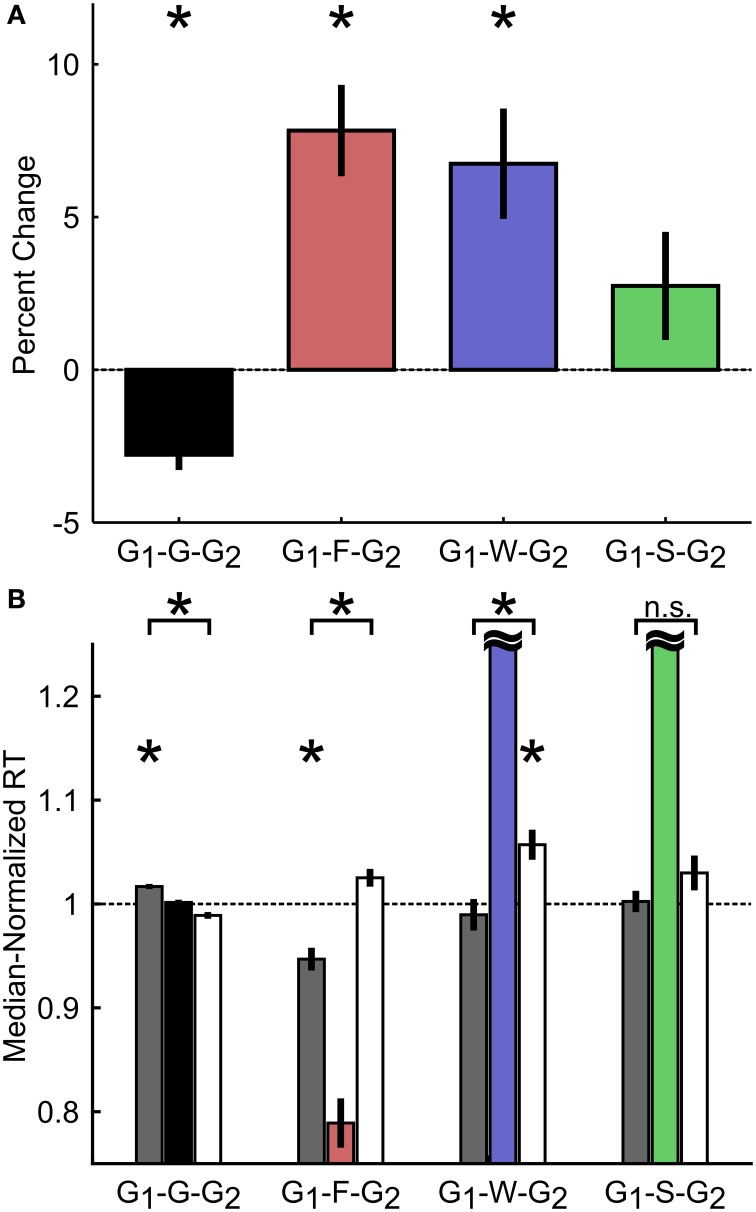
Figure 7.
Proactive adjustment of RT based on trial outcome. (A) Percent change in RT between Go trials preceding (G1) and following (G2) different trial outcomes. G1-G-G2 refers to three consecutive go trials (F, failure-to-stop; W, failure-to-wait; S, stop success). (B) Median-normalized RT for the Go trials preceding (gray) and following (white) each trial outcome. Horizontal black dashed line indicates median RT. Intermediate trial data were included for visualization purposes only and not included in statistical analyses. Asterisks represent means significantly different than 1 or significant differences between groups, corrected for multiple comparisons. Error bars represent s.e.m. n = 10 rats.

