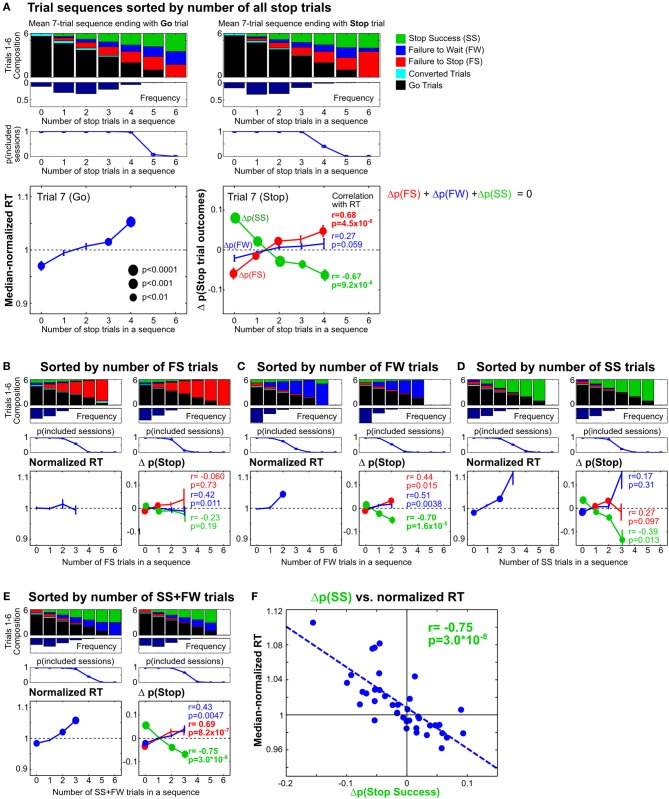
Figure 8.
Proactive adjustments of RT and stop performance by recent stop trials. (A) Comparison of 7-trial sequences ending with a Go trial (left) or a Stop trial (right), sorted by the total number of all stop trials in trials 1–6. The top three rows show the average trial composition in trials 1–6 in each trial sequence category (top row), the respective relative frequencies (second row) and sessions containing at least 5 sequences in each trial sequence category (third row). The bottom row shows, for each trial sequence category, the median-normalized RTs (left) and the difference between the observed and predicted stop trial outcomes (right) in trial 7. The difference between the observed and predicted stop trial outcomes [Δp(Stop)] represents the influence of recent Stop trial frequency on subsequent stop performance beyond what would be expected given the observed distribution of SSDs for that trial sequence category. P-values for t-test (n = 10) are represented by the size of circles. R and p-values for Pearson correlation between median-normalized RTs and Δp(Stop) are indicated next to each type of Stop trial outcome. (B–E) The same analysis as in (A), sorted by the number of failure-to-stop trials (B), failure-to-wait trials (C), successful stop trials (D), or the number of successful stop trials and failure-to-wait trials combined (E). (F) Correlation between median-normalized RTs and Δp(Stop Success) based on trial sequence categories in (E). These results show that proactive adjustments of RT and stop performance are highly correlated and jointly driven by recent failure-to-wait and successful stop trials.

