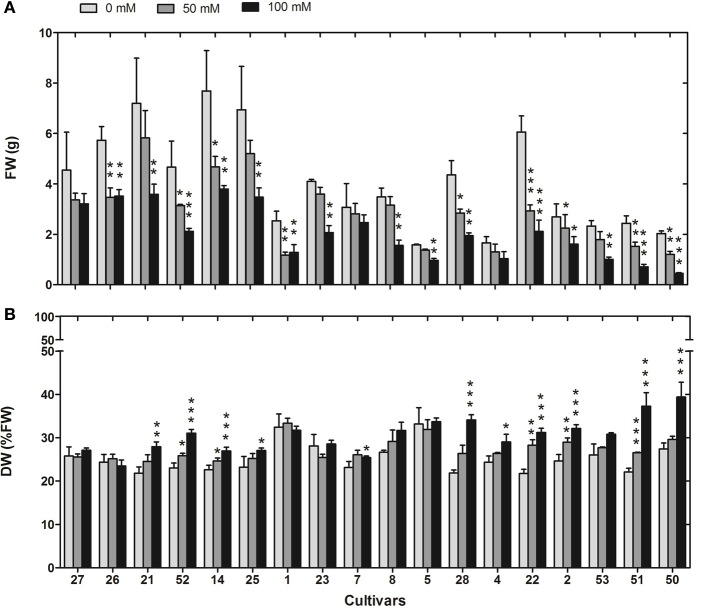
Figure 3.
FW (A) and DW as %FW (B) of 18 rice cultivars under control conditions and after 13 days at 50 mM or 100 mM NaCl in hydroponic culture. Means of three independent experiments with five replicate plants each are shown with standard errors. Significance levels are indicated as: p < 0.001 (***), 0.001 < p < 0.01 (**), 0.01 < p < 0.05 (*) in comparison to control. Cultivars are sorted from the most tolerant to the most sensitive from left to right.

