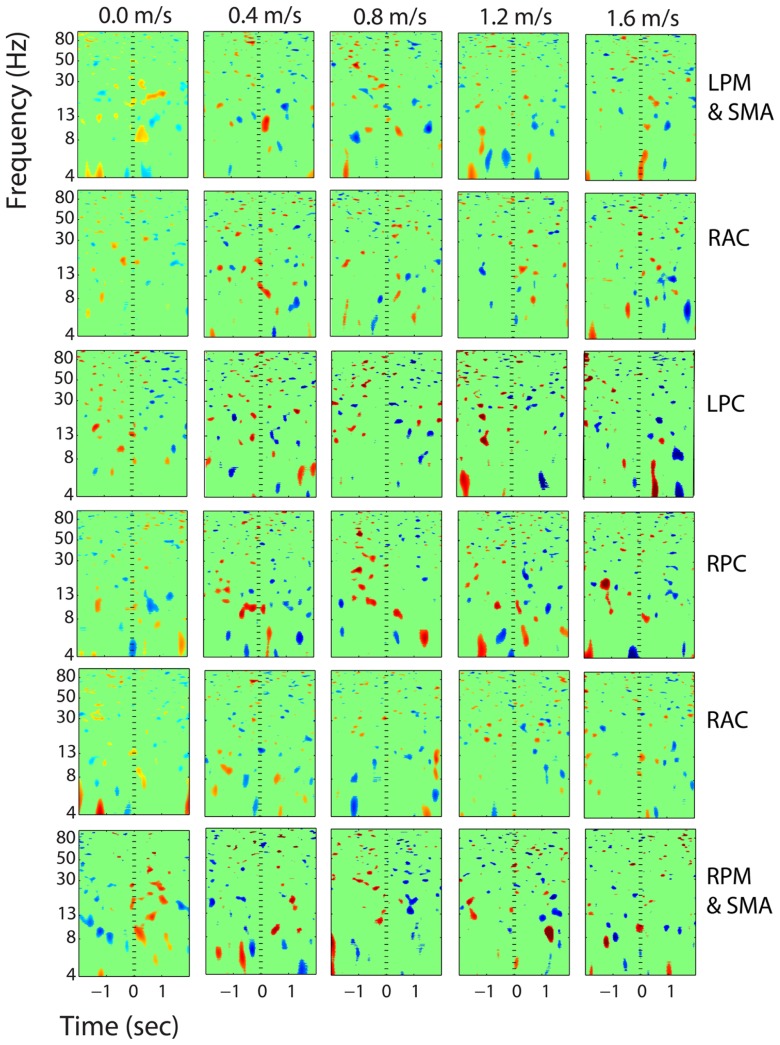
FIGURE 12.
Event-related spectral perturbation plots showing power change around the presentation of a stimulus (a digit and its position in an imagined grid) in the additional six clusters with independent components from >10 subjects. Each row is one cortical area. From top to bottom, the cortical areas are left premotor and supplementary motor area (LPM and SMA), right anterior cingulate (RAC), left posterior cingulate (LPC), right posterior cingulate (RPC), and right premotor and supplementary motor area (RPM and SMA). The color scale is from -0.5 to 0.5 db.

