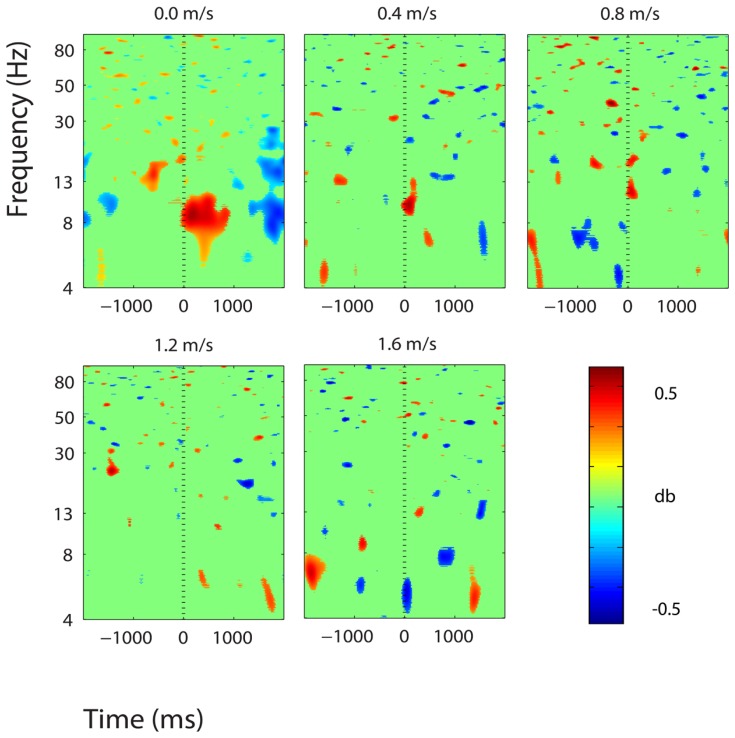
FIGURE 8.
Event-related spectral perturbation plots showing power change around the presentation of a stimulus (a digit and its position in an imagined grid) in the premotor and supplementary motor cortex (BA 6). Red represents a power increase from baseline and blue represents a power decrease from baseline. We set non-significant differences to 0 dB (green). The stand condition ERSP is the average of all three standing Brooks spatial working memory task trials.

