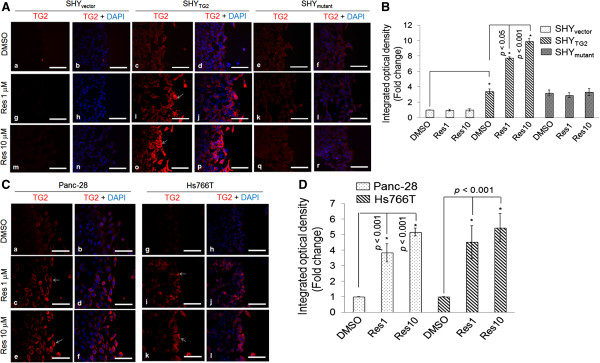
Figure 2.

Immunofluorescence signal for TG2 in SH-SY5Y cells and pancreatic cancer cells. Representative immunofluorescence images showing TG2 level (red color) in SHYvector, SHYTG2 and SHYmutant cells (A), and Panc-28, Hs766T cells (C). After treatment with resveratrol (1 or 10 μM) in scratch assays, cells were labeled with anti-TG2 antibody. Nuclei were counter-stained with DAPI (blue) and slides were examined under fluorescence microscope. Pictures were taken randomly from the edge of scratch and are representative of at least 3 independent experiments. Enhanced red fluorescence (white arrows) in cells present near the scratch depicts increased immunoreactivity for TG2, and quantitated by Image-Pro Plus software and plotted. Corresponding bar diagrams represent the fold change in fluorescence intensity (integrated optical density, IOD) (B and D). *p value < 0.05. Scale bar = 100 μm.
