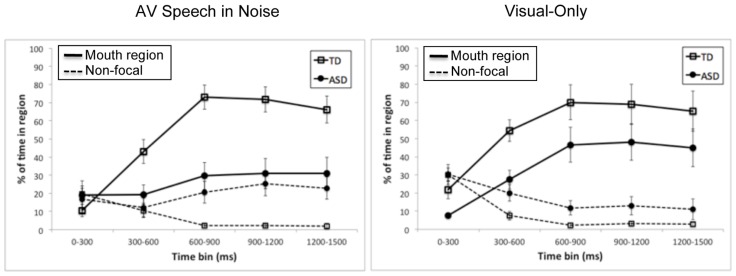
FIGURE 3.
Mean time spent on the mouth region (solid lines) and non-focal areas (dashed lines) as a percentage of time spent on the face for each of the time bins and for the ASD group (closed circles) and the TD group (open squares). The left and right panels present results for AV speech in noise and visual-only, respectively. Error bars represent standard errors, calculated independently for each time bin.

