Figure 3.
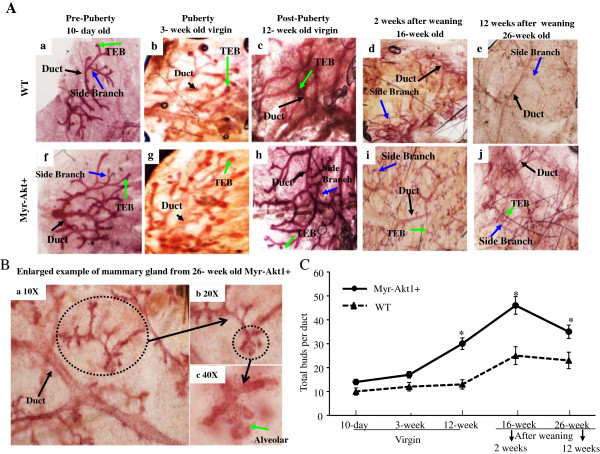
Effect of myr-Akt1 in mammary gland development. Representative whole mounts of WT (Aa to Ae) and myr-Akt1+ (Af to Aj) mammary glands at the indicated ages and stages. Black arrows indicate ducts. Blue arrows indicate side branches and green arrows indicate terminal end bubs (TEB). (B) An enlarged example of duct and alveolar buds from mammary glands of 26 week old myr-Akt1+ mice (12 weeks after weaning). (C) Quantification of the average number of buds per duct in the indicated ages and stages of WT and myr-Akt1+ mice. The numbers of bubs were counted and divided by the total number of ducts in the fields. Five fields per mouse were counted in the 12 week, 16 week and 26 week age groups. Two mice per age group and per genotype were used for analysis. The data represented in line plot is mean ± SD and “*” indicates p < 0.05 compared to WT mice at same age.

