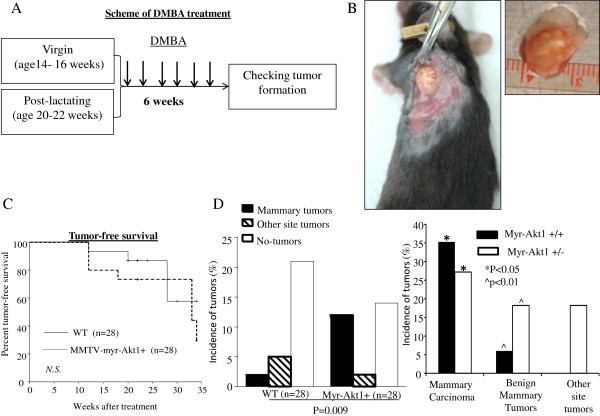
Figure 4.
Tumor development in wild-type and MMTVmyr-Akt1 transgenic mice treated with DMBA. (A) Experimental design and scheme of DMBA treatment. (B) Mammary gland tumor growth in transgenic mouse. (C) Tumor-free survival curves in wild-type and MMTVmyr-Akt1 transgenic mice, analyzed by Kaplan-Meier survival curve analysis with log-rank test. (D) Bar graphs indicate incidences of tumor formation in wild-type (WT) and transgenic mice (MMTVmyr-Akt1) (left), and incidences of mammary gland tumors and other site tumors in transgenic mice from MMTVmyr-Akt1 +/+and MMTVmyr-Akt1 +/-groups (right). At left, p = 0.009 indicates the significant differences in the incidence of mammary tumor and other organ site tumor formation among WT and myr-Akt1 mice. At right, “*” indicates p < 0.05 between the indicated two groups and "^" indicates p < 0.01 between the indicated two groups.

