Figure 5.
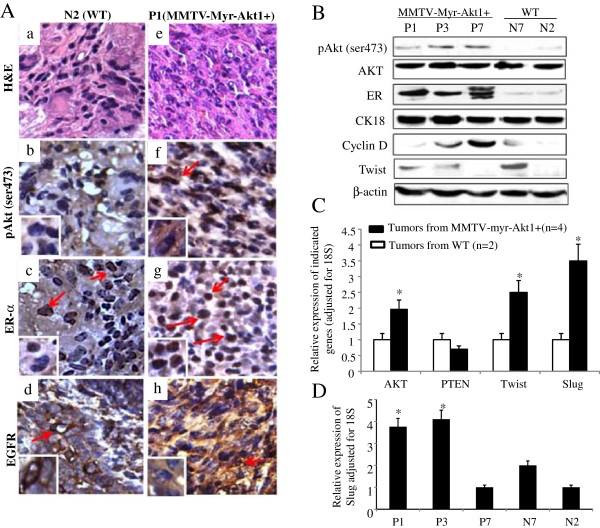
Characterization of malignant mammary tumors. (A) H&E staining (a and e) and immunohistochemical analysis were used to determine the level of phospho-Akt1 (pAkt ser473) (b and f), ERα (c and g), and EGFR (d and h) expression in mammary tumors from wild-type mouse (N2) and MMTVmyr-Akt1 transgenic mouse (P1). The arrows indicate positive staining. (B) Protein was extracted from the mammary tumors and western blot analysis was used to determine the indicate protein expression. (C) RNA was extracted from mammary carcinomas from four transgenic mice and two wild-type mice. RT-Q-PCR was performed with the indicated primers. The bar graph indicates relative expression levels of the indicated genes adjusted for 18S from the four transgenic and two wild-type mice. Each bar indicates mean and SD of three individual tests. “*” indicates p < 0.05 between the two groups for the indicated genes. (D) RNA samples from mammary tumors of transgenic mice (P1, P3, and P7) and wild-type mice (N7 and N2). RT-Q-PCR was performed to quantify levels of slug. The bars indicate relative levels of slug adjusted for 18S expressed in the mammary malignant tumor samples from the indicated mouse. Each bar indicates mean and SD of three individuals test. “*” indicates p < 0.05 compared to N2 and N7 respectively.

