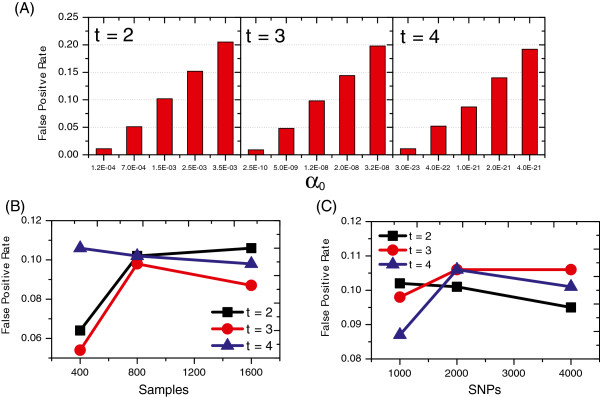
Figure 1.

False positive rates under null models. The plot in A shows the false positive rates of DCHE using different α0s for different ts, and the plots in B and C show the false positive rates of DCHE for different ts when sample size and the number of SNPs vary.
