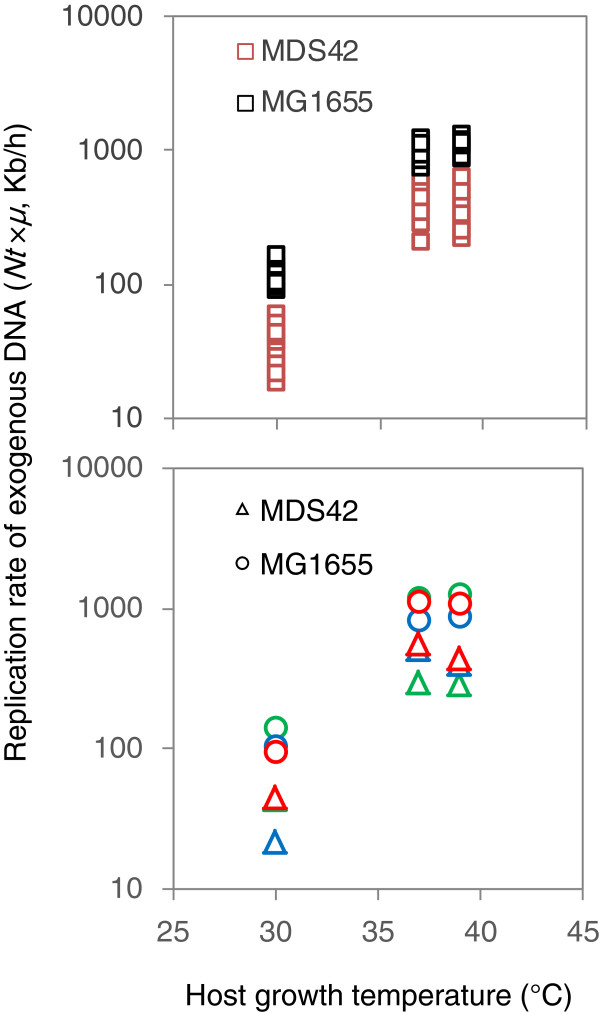
Figure 5.
Comparison of replication rates of exogenous DNA in MG1655 and MDS42. The replication rates of exogenous DNA in MG1655 (black squares) and MDS42 (red squares) at various growth temperatures (30, 37 and 39°C) are shown in the upper panel. The averaged replication rates for three different sizes of plasmids (S, M and L displayed in green, blue and red, respectively) are shown in the bottom panel. The replication rates of the plasmids in the strains MDS42 and MG1655 are represented by circles and triangles, respectively. The color scheme is as described in Figure 1.

