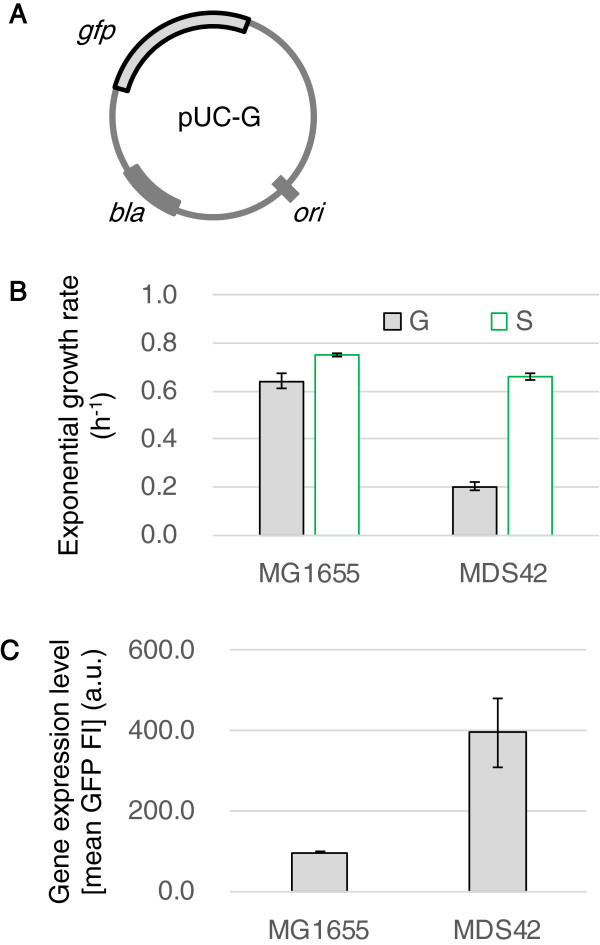
Figure 6.
Cost of gene expression of foreign DNA. A. Schematic drawing of the plasmid pUC-G. B. Exponential growth rates of host cells that contain plasmids. G and S indicate the host cells (MG1655 and MDS42) that contain pUC-G or pUC-S, respectively. C. Gene expression levels in MG1655 and MDS42. The mean values of GFP fluorescence intensities (GFP FIs) were calculated to determine the relative levels of gene expression in the host cells, MG1655 and MDS42. The bars represent the standard errors of triplicates. Both increased expression and decreased host growth occurred in MDS42 were highly significant (p < 0.001).

