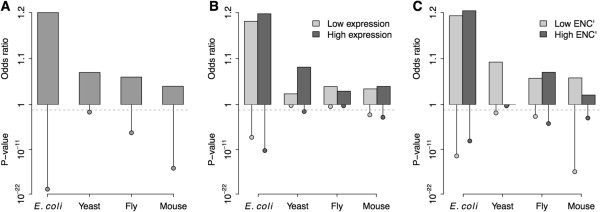
Figure 1.

Odds ratios and significance levels generated by Mantel-Haenszel procedure. A) Comparison between species; B) Comparison between the 50% highest and lowest expressed genes; and C) Comparison between the genes with the top and bottom 50% ENC’ level. The dashed line denotes the significance level of α = 0.05.
