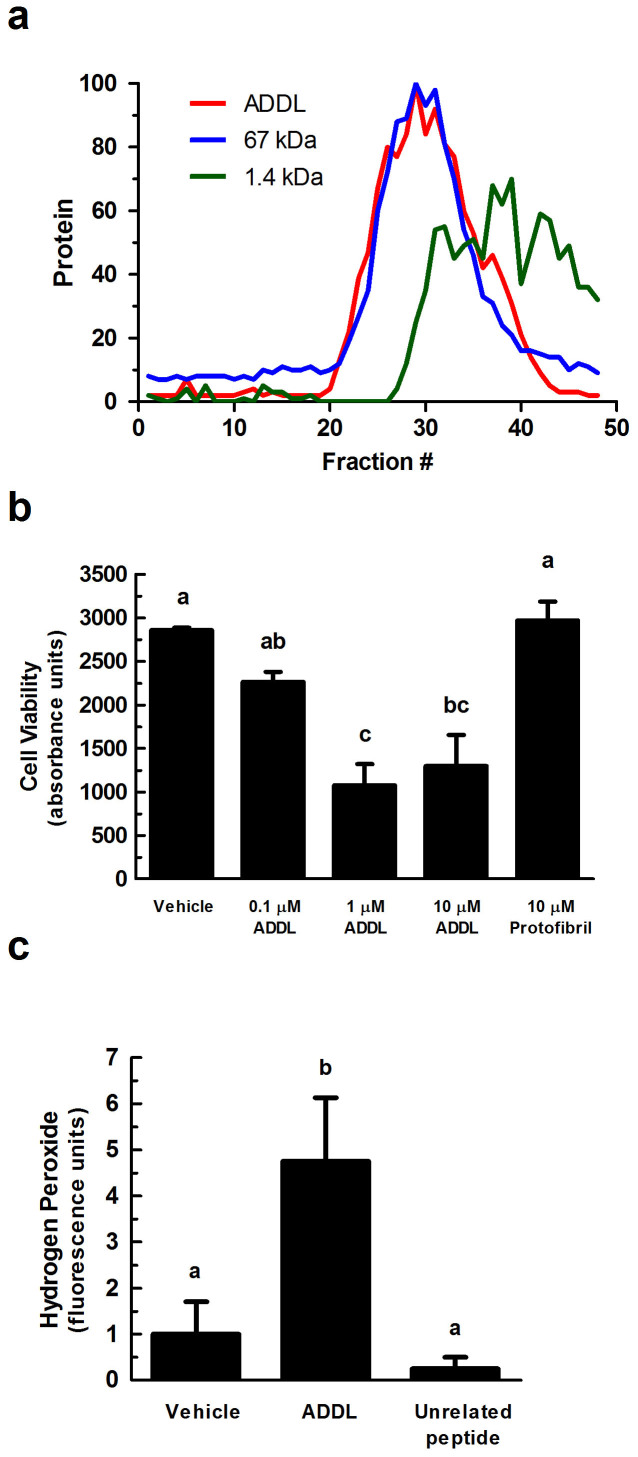
Figure 1. ADDL-induced toxicity in primary cortical/hippocampal neurons.
(a) ADDLs were subjected to gel filtration (using Sephadex G-50 beads) to characterize their sizing behavior. Any molecule greater than 30 kDa is excluded from the column (~fraction 20). Red line = ADDLs, blue line = 67 kDa protein, and green line = 1.4 kDa peptide. Y-axis is normalized protein intensity as quantified by Image J software. (b) Primary rat cortical/hippocampal cultures were treated with ADDLs (0.1, 1, and 10 μM), as indicated, for 24 hours. Cell viability was determined using the water soluble tetrazolium cell proliferation assay (WST-1). Bars represent mean ± SEM for triplicate samples. Means followed by the same letter are not significantly different according to Tukey's Multiple Comparison Test (p > 0.05). (c) Hydrogen peroxide production was measured using the Amplex® Red reagent (10-acetyl-3,7-dihydroxyphenoxazine). ADDLs (1 μM for 24 hours) induced hydrogen peroxide production in primary rat cortical/hippocampal neurons. Statistical analysis was performed using one-way analysis of variance (ANOVA). When ANOVA indicated significant treatment effects, means were separated using Tukey's Multiple Comparison Test. Bars represent mean ± SEM for quadruplicate samples. Means followed by the same letter are not significantly different (p > 0.05). Similar results were seen in three additional experiments.

