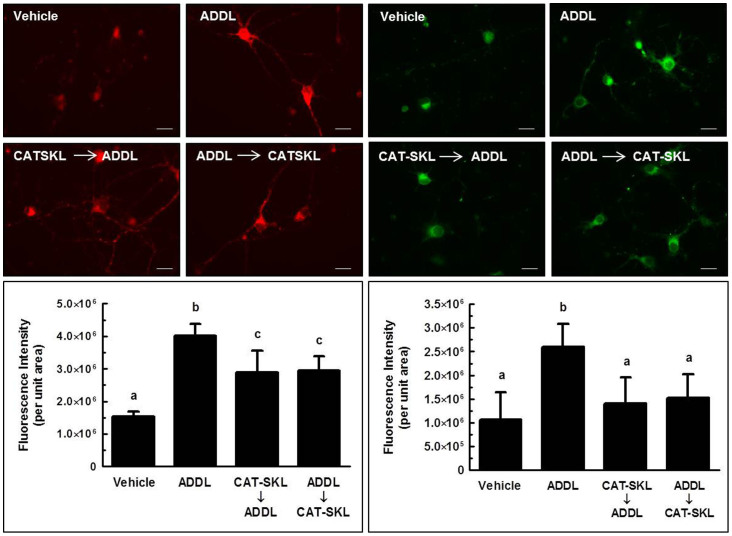
Figure 6. CAT-SKL's effects on mitochondria in ADDL-treated neurons.
Left panel: Mitochondrial ROS was determined using the MitoTracker® Red CM-H2XRos selective probe (red fluorescence). Right panel: Mitochondrial depolarization was visualized using the JC-1 mitochondrial potential sensor (green fluorescence). Quantification (insets) was accomplished using Image J shareware. Statistical analysis was performed using one-way ANOVA. When ANOVA indicated significant treatment effects, means were separated using Tukey's Multiple Comparison Test. For left and right inset graphs, bars represent mean ± SEM for replicate samples (n = 6 and n = 8, respectively). Means followed by the same letter are not significantly different (p > 0.05). Scale bar = 20 μm.

