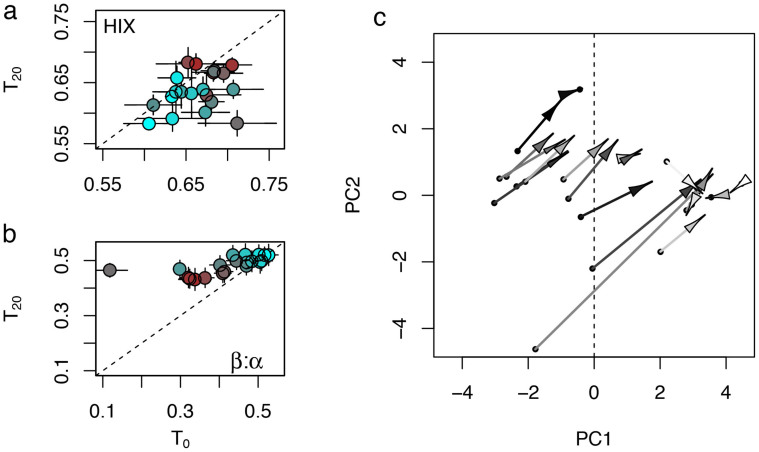
Figure 4. DOM composition during microbial degradation.
(a) The humification index (HIX) and (b) the freshness index (β/α) at start of the degradation assays (T0) and after the 20-day incubation period (T20). Given is the mean ± SD (n = 3 replicates) and the dashed line indicates a 1:1 relationship (i.e., no change during degradation) Original DOM composition as derived from the PCA is indicated by colour. Brown colours denote streams with predominantly terrigenous DOM and blue colours represent streams with relatively more autochthonous DOM. (c) Shifts in DOM composition over the 20-day experiments. Starting coordinates of arrows (indicated by black circles) are identical with scores of the PCA based on optical measures (Figure 1b). End coordinates are predicted scores computed with the PCA eigenvectors and the optical measures at the end of the experiments. Lengths of arrows denote the intensity of the shift in DOM composition. The greyscale indicates CUE; ranging from black (lowest CUE) to white (highest CUE).

