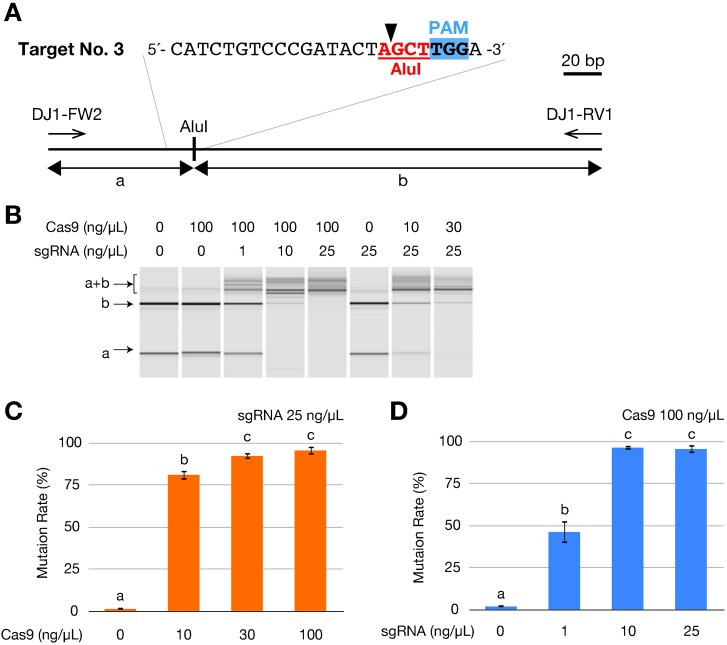
Fig. 3. Dose-dependent mutagenesis by the RGENs.
(A) Schematic illustration of restriction fragment length polymorphism (RFLP) analysis to calculate mutation frequencies. The sgRNA no. 3a contatin an AluI restriction enzyme site (Red letters with underline) on the potential cleavage site indicated by an arrowhead. A 285 bp fragment amplified using primers DJ1-FW2 and DJ1-RV1 produces both 75 bp (a) and 210 bp fragments by AluI digestion in wild type. (B) Gel image of AluI-digested fragments analyzed in MultiNA system. The RGEN-injected embryos exhibited undigested fragments (a+b). Images from a representative embryo injected with varying amounts of Cas9 RNA and sgRNA no. 3a are shown. (C,D) Mutation rates at each injected Cas9 RNA concentration with 25 ng/µL of sgRNA (C) and at each injected sgRNA concentration with 100 ng/µL of Cas9 RNA (D). The mutation rate was calculated as the molar concentration of the undigested fragment (a+b) with AluI as a percentage of the sum of molar concentrations of the undigested fragment (a+b) and the larger digested fragment (b). The molar concentration of each fragment was quantified using the MultiNA Viewer software. Columns and error bars represent mean ± s.e.m. (n = 12). The different letters at the top of the columns indicate significant differences (P<0.05; one-way ANOVA followed by Tukey's HSD test).

