
Fig. 3. Representative growth curve of WT, A1-KO, A2-KO and A1/A2-KO MEFs.
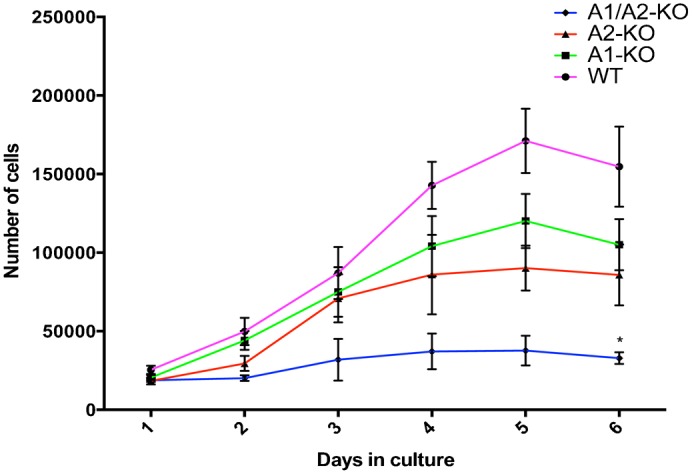
MEFs from WT (circle), A1-KO (square), A2-KO (triangle) and A1/A2-KO (diamond) embryos at 12.5 dpc, at culture passage 4, were plated and counted daily for 6 days to extrapolate growth curves. The growth curves refer to three MEF preparations for each genotype plated in triplicate. Values represent means ± SEM. *P<0.05 versus WT.