
Fig. 7. E2F1 acetylation in A1/A2-KO MEFs.
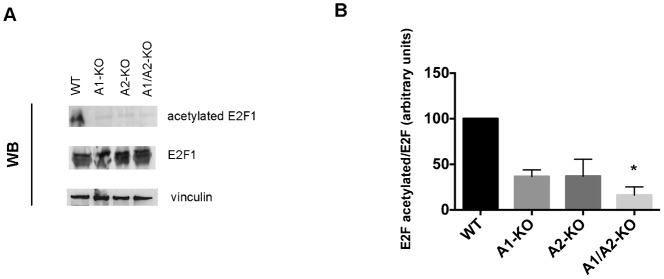
(A) Western blot analysis of acetylated and total form of E2F1 in representative WT, A1-KO, A2-KO and A1/A2-KO MEFs. Vinculin was used as loading control. (B) Densitometric analysis of the levels of acetylated E2F1 versus E2F1 total in WT, A1-KO, A2-KO and A1/A2-KO MEFs. Level of acetylated E2F1 versus E2F1 total in WT was assumed as 100 (arbitrary units). These values represent the means ± SEM of two experiments. *P<0.05 versus WT.