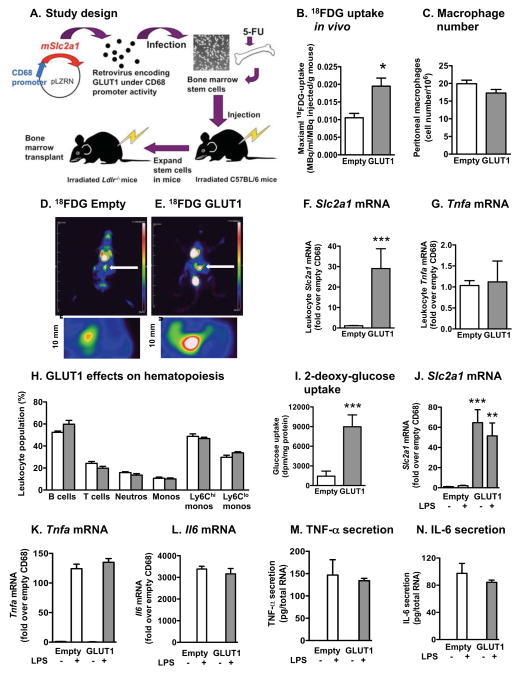
Figure 3. Overexpression of GLUT1 in myeloid cells in vivo does not increase their inflammatory phenotype.
(A) Study design. (B–E) 18FDG PET analysis of peritoneal macrophages in Ldlr−/− mice fed the low-fat semipurified diet. Foci of peritoneal macrophages are indicated by white arrows and examples of the analyzed areas are shown in higher magnification under the whole mouse images. At the end of the 30 min image collection, peritoneal macrophages were fixed. The next day, the number of cells was determined by counting (C). Slc2a1 and Tnfa mRNA levels were measured by real-time PCR in leukocytes 22 weeks after bone marrow transplants (F–G). (H) Circulating leukocyte populations (% of total live cells) were analyzed by flow cytometry. Ly6Chi and Ly6Clo monocyte populations are expressed as % of total monocytes. At the end of the 22-week study, thioglycollate-elicited macrophages were collected and adherence purified for 1 h. (I) Glucose uptake was measured by [3H]-2-DOG uptake. (J–L) Slc2a1, Tnfa, and Il6 mRNA levels were measured by real-time PCR. (M–N) Macrophages were stimulated in the presence or absence of LPS for 24 h, and TNF-α and IL-6 secretion was measured by ELISA. Results are presented as mean ± SEM (n=3–5). Statistical analysis was performed by two-tailed unpaired Student’s t-test or one-way ANOVA followed by Neuman Keuls post-hoc test. *p<0.05; **p<0.01; ***p<0.001 compared to empty control virus. See also Figure S3

