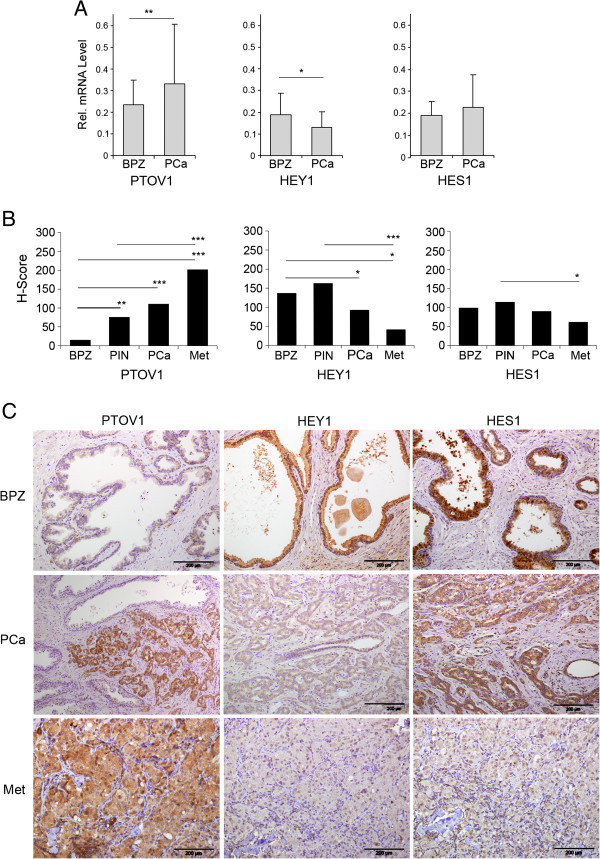
Figure 7.
PTOV1 displays expression patterns reciprocal to those of HEY1 and HES1 in benign prostate, primary prostate carcinoma and metastasis. (A) PTOV1 transcripts levels increases from normal prostate to primary prostate cancer samples, while HEY1 expression declines from normal to neoplastic tissues. mRNA from 43 prostate adenocarcinomas (PCa) and their corresponding benign epithelial glands from the peripheral zone (BPZ) were analyzed by real-time PCR using specific primers and probes for HES1, HEY1 or PTOV1. Values represent mean + SEM of mRNA expression relative to RPS14 control. PTOV1 levels are significantly increased in PCa compared to BPZ. HEY1 levels in BPZ are significantly decreased in PCa. A significant inverse correlation between the expression levels of HEY1 and PTOV1 is evidenced (Pearson coefficient = 0.87). (B) The expression levels of PTOV1, as determined by immunohistochemistry, increases along with metastatic progression of PCa, while expression levels of HEY1 and HES1 declines with progression. Protein expression levels were assigned semiquantitative values by the Hscore method in benign epithelium (BPZ), pre-malignant HGPIN lesions, PCa, and 16 lymph node metastasis (Met). (C) Representative images from immunohistochemical staining of serial sections from PCa and metastasis (Met) with specific antibodies to HEY1, HES1 or PTOV1. Slides were counterstained with hematoxylin. PTOV1 staining is low or undetectable in BPZ, and strong expression is observed in PCa and Met. HES1 and HEY1 show strong staining in benign epithelial glands in BPZ and HGPINs. A significantly decreased staining intensity is observed for HEY1 in cancerous areas of PCa and metastasis, relative to BPZ. Staining intensity for HES1 is comparable between epithelial glands of BPZ, HGPIN and cancerous areas of PCa, but the intensity is significantly weaker in metastases (Met). Bars indicate average Hscore values.* p < 0.05, ** p < 0.005,*** p < 0.0005.

