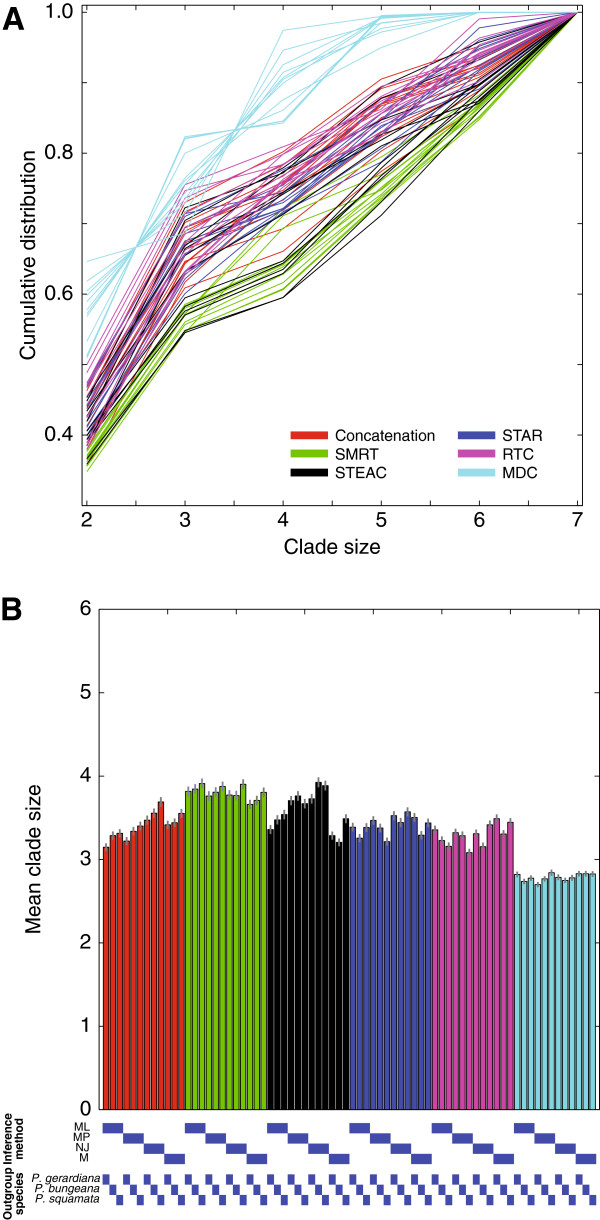
Figure 3.
Distribution of clade size for phylogenetic inference strategies.(A) Cumulative distribution of clade sizes. Each bar represents a strategy, of which there are 12 per color. (B) Mean clade size for phylogenetic inference strategies, calculated as the mean size of all clades inferred across 1000 bootstrap replicates. Vertical lines centered at the top of vertical bars represent standard errors of mean clade sizes.

