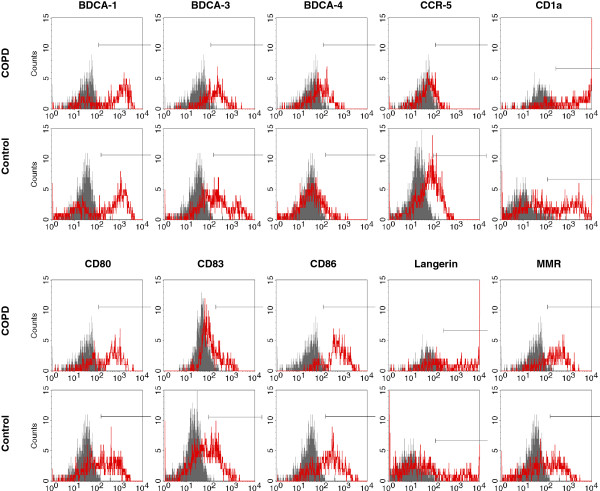
Figure 2.
Histogram plots of mDC surface markers in BALF. Myeloid DCs were identified as linneg/dimHLA-DR+CD11c+ cells. Histograms show the staining of these cells with antibodies against surface markers (marker antibody, red) compared to the staining with respective isotype control antibodies (control antibody, grey). The figure shows examples from a current smoker with COPD (COPD) and a healthy never-smoker (Control).

