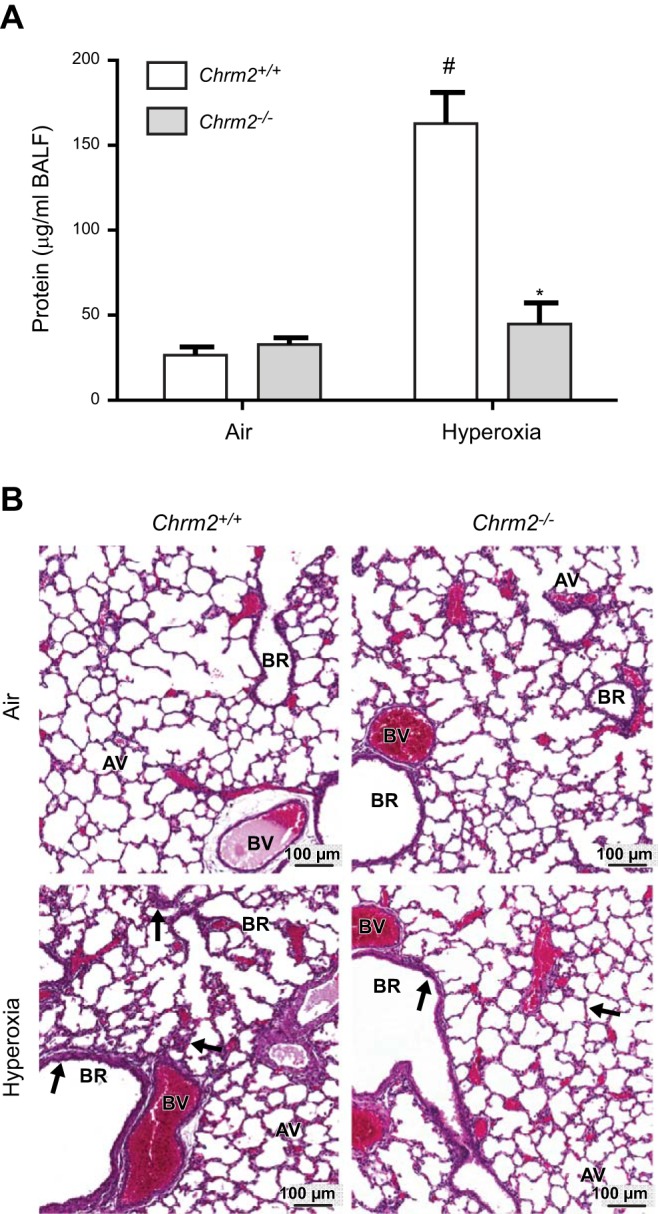
Figure 5.

Differential pulmonary responses to hyperoxia exposure in Chrm2+/+ and Chrm2−/− neonates. A) BALF protein concentrations. B) Representative H&E-stained histopathology images. Arrows indicate differences in alveolar edema and thickening of the bronchial epithelium and alveolar septae. AV, alveoli; BR, bronchus or bronchiole; BV, blood vessel. Bars represent means ± sem (n=6–9/group). *P < 0.05 vs. Chrm2+/+; #P < 0.05 vs. air; 2-way ANOVA.
