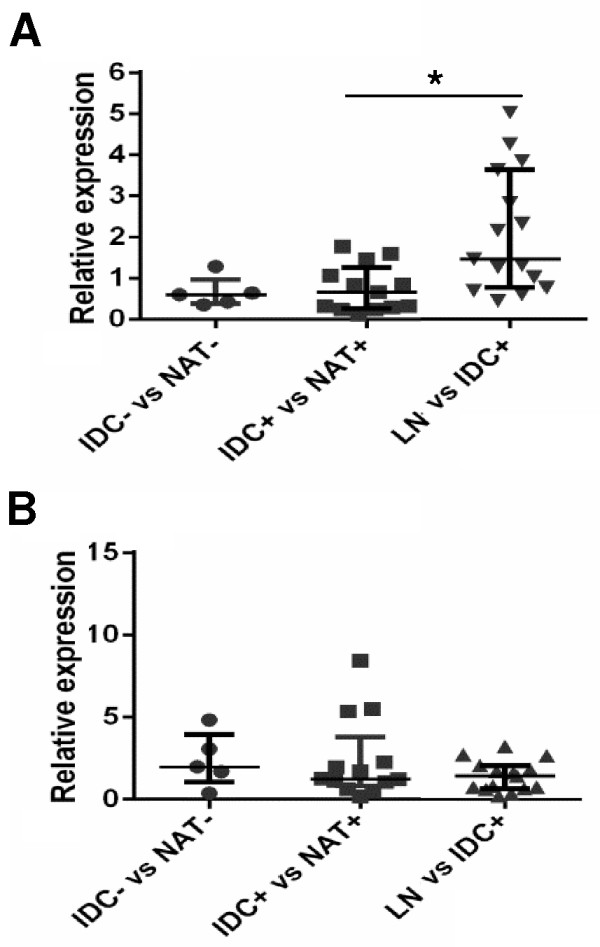
Figure 2.

Dicer and Drosha expression in tumours and lymph node metastases. Relative quantification of A) Dicer and B) Drosha by real-time RT-PCR in NAT from LN- patients versus matched LN- tumours (IDC- vs NAT-, n = 5), NAT from LN + patients versus matched LN + tumours (IDC + vs NAT+, n = 13) and LN metastases versus matched LN + tumours (LN vs IDC+, n = 15). Results are shown as the fold change (2-ΔΔCt) of Dicer and Drosha expression in matched cases, *p = 0.0202.
