Fig. 4.
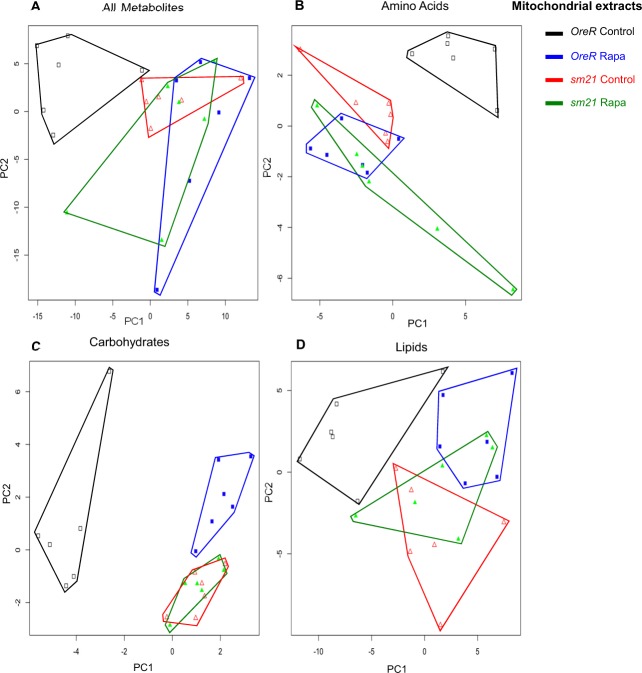
Metabolic reprogramming of mitochondrial extracts by mtDNA genotype and rapamycin treatment. PCA was performed on a sample of 230 metabolites detected on the mitochondrial extracts from flies carrying OreR and sm21 mtDNA genotypes treated with vehicle control or 200 µm rapamycin. (A) PCA of all 230 metabolites. (B) PCA of 39 amino acids or amino acid derivatives. (C) PCA of 20 carbohydrates. (D) PCA of 83 lipids. Complete lists of these metabolites are provides in supplementary material Table S1. Black open squares, OreR mtDNA on control diet; blue solid squares, OreR mtDNA on rapamycin; red open triangles, sm21 mtDNA on control diet; green solid triangles, sm21 mtDNA on rapamycin. Polygons surrounding points are intended to aid the visualization of the six replicate samples for each treatment. See text and supplementary material Fig. S2 for statistical analyses.

