
Figure 1.
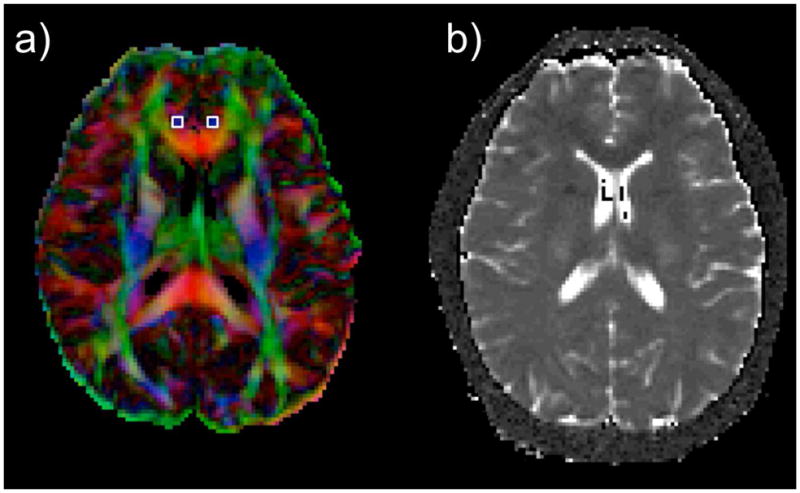
Representative slices from a subject showing images used to extract the values in cingulate-paracingulate white matter. Note: (a) Color Fractional Anisotropy images with left and right regions of interest on the cingulum (b) Transverse relaxation time (T2) map obtained by fitting the multi spin-echo steps.