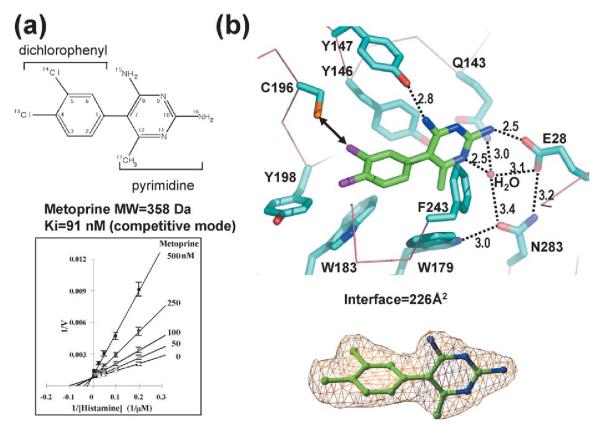
Figure 2.
Interactions of HNMT–metoprine. (a) Chemical structure of metoprine (top panel). Lineweaver–Burke plot (bottom panel). The slope of each linear fit was plotted against the concentration of inhibitor and the intercept on the x-axis gave an estimate of Ki (91 nM). (b) Detailed plot of HNMT–diphenhydramine interactions. Replacing the chlorine atom (CL14) in the dichlorophenyl ring with sulfur might improve its interaction with Cys196 (indicated by a double-ended arrow). The simulated-annealing omit electron density map is contoured at 3.5σ above the mean (bottom panel).

