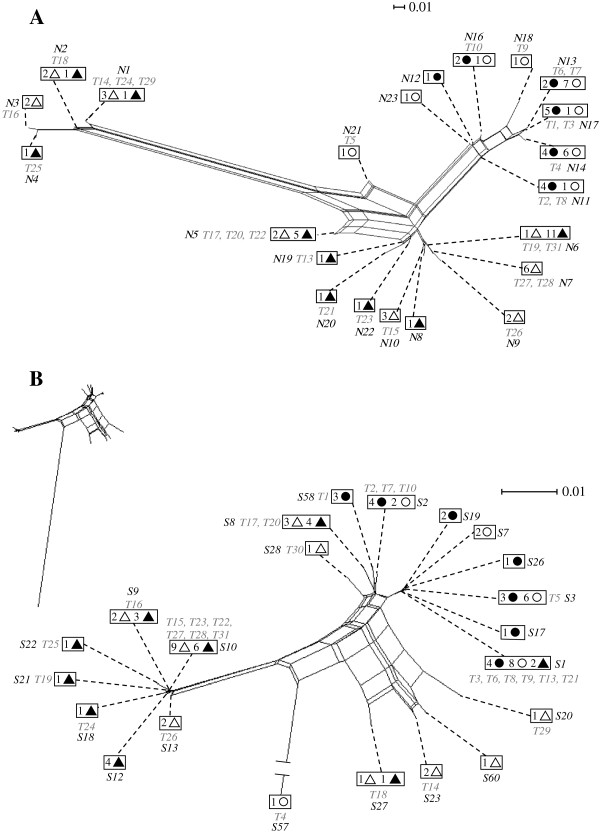
Figure 1.
Genotype networks generated by the neighbor-net algorithm. (A)NifD locus, based on the distance calculated by MODELTEST, using a GTR + I model of sequence evolution [121]. (B)ITS region, based on the distance calculated by MODELTEST using a HKY + I + G model of sequence evolution [122]. Dotted lines represent the position of a genotype on the network. Each box represents one genotype, each symbol represents a host species (filled circles represent bacteria harvested from nodules of A. strigosus; open circles, A. heermannii; filled triangles, L. bicolor; open triangles, L. arboreus), and numbers indicate the number of strains representing a particular genotype; labels T1 to T31 in italics represent the Bradyrhizobium genotypes used in the greenhouse experiment (as listed in Additional file 1: Table S1). One genotype, T30, appears only in the ITS network, because we were unable to sequence its NifD locus. Genotypes T11 and T12 do not figure in either network because they were addenda from another study, used for reference, but not part of the original sample.

