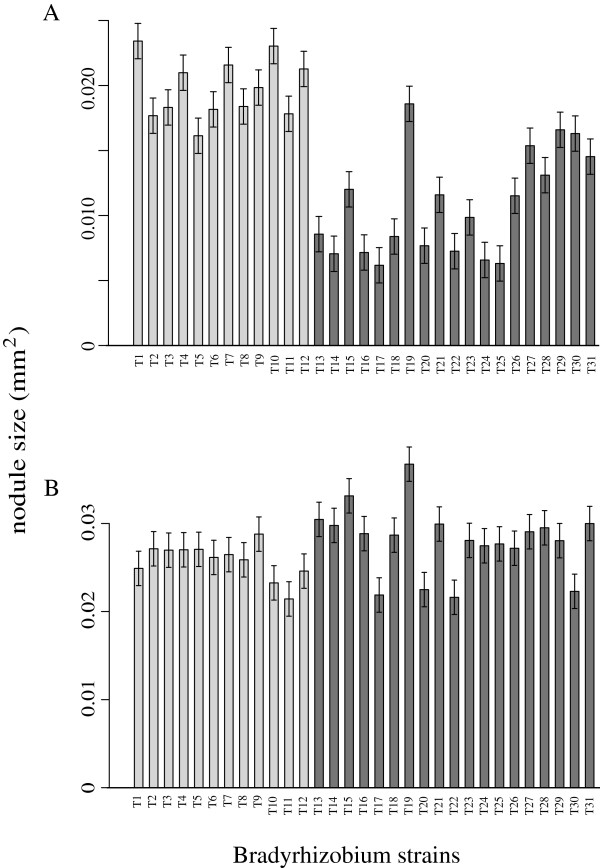
Figure 3.
Average nodule size produced by each Bradyrhizobium genotype on each host species. Untransformed data (cm2). A)A. strigosus. B)L. bicolor. Error bars represent ± 1 standard error. Solid grey bars represent bacteria originally isolated from A. strigosus and A. heermannii nodules (A bacterial group); solid black bars represent bacteria harvested from L. bicolor and L. arboreus nodules (L bacterial group).

