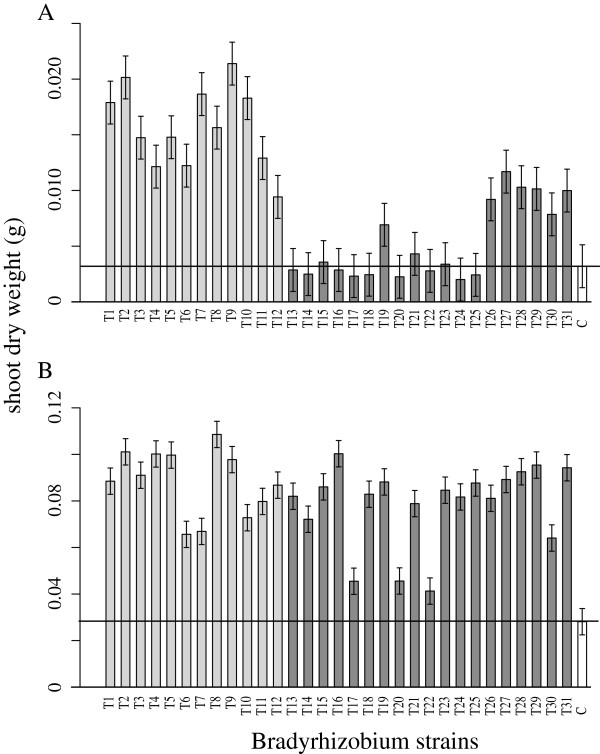
Figure 4.
Mean shoot dry weight of each host species when inoculated by each Bradyrhizobiumgenotype. Untransformed data (g). (A) A. strigosus. (B) L. bicolor. Error bars represent ± 1 standard error. Horizontal reference lines represent mean dry weight of uninoculated control plants. Light grey bars represent bacterial group A, originally isolated from A. strigosus and A. heermannii nodules; dark grey bars represent bacterial group L, originally isolated from L. bicolor and L. arboreus nodules; solid white bars represent uninoculated control plants. Genotype order recapitulates that found in Figures 2 and 3.

