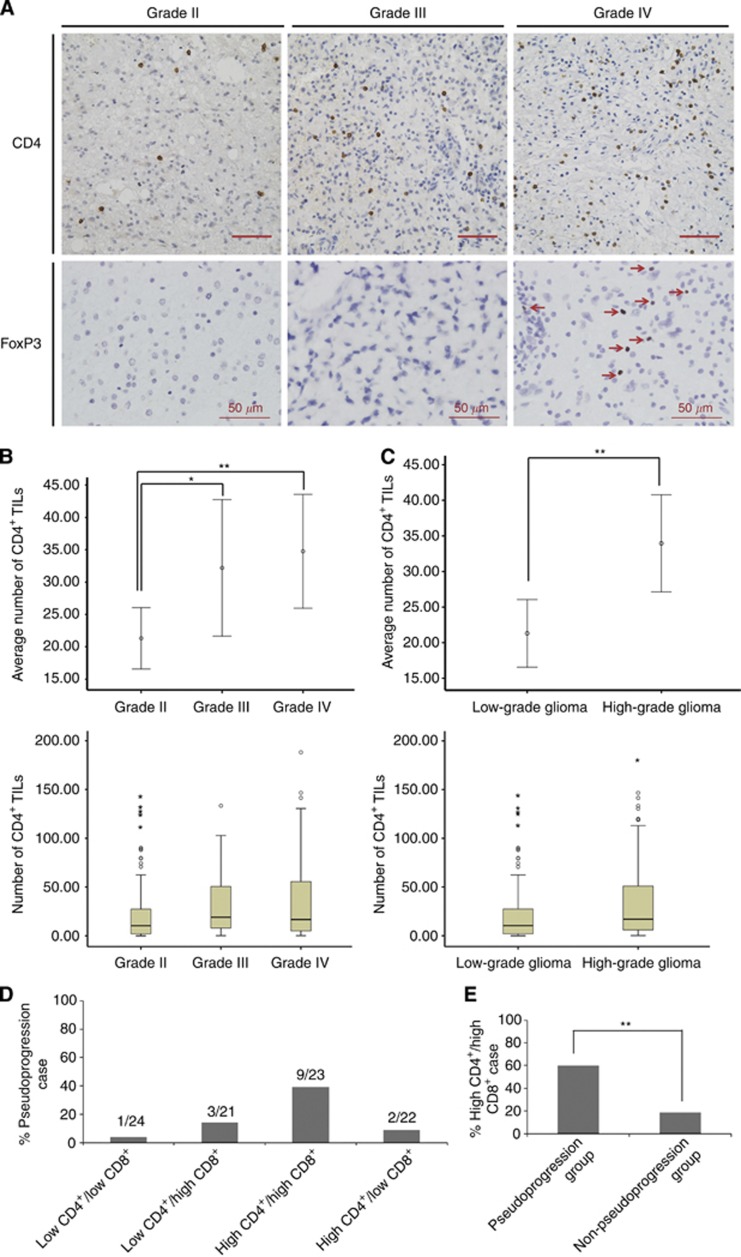
Figure 2.
CD4+ and FoxP3+ tumour-infiltrating lymphocytes (TILs) in gliomas. (A) Representative immunohistochemical images of CD4+ and FoxP3+ TILs in glioma. Arrows, FoxP3-positive cells. (B and C): The number of CD4+ TILs in different grades of glioma. (D) The distribution of pseudoprogression cases among different groups. (E) The percentage of high CD4+/high CD8+ cases in pseudoprogression and non-pseudoprogression groups. Scale bars, 50 μm. *P<0.05, **P<0.01.

