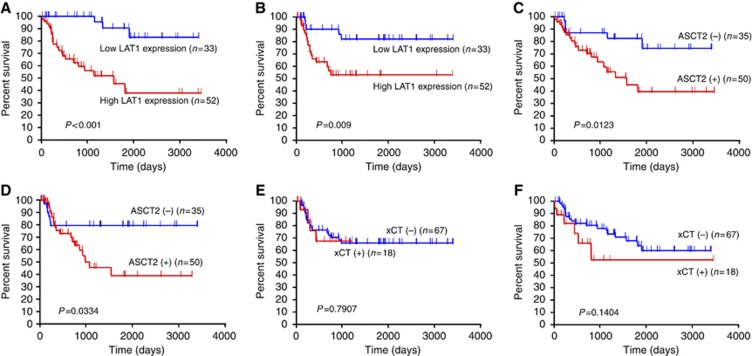
Figure 2.
Kaplan–Meier analysis of overall survival (OS) and progression-free survival (PFS) according to LAT1, ASCT2, and xCT expression. A statistically significant difference in OS and PFS was observed between the patients with high LAT1 and those with low LAT1 tumour expression (OS, P<0.001(A); PFS, P=0.009 (B)), and between the patients with positive and negative ASCT2 tumour expression (OS, P=0.012 (C); PFS, P=0.033 (D)). No statistically significant difference in OS (E) and PFS (F) was observed between the patients with positive xCT and those with negative xCT tumour expression.

