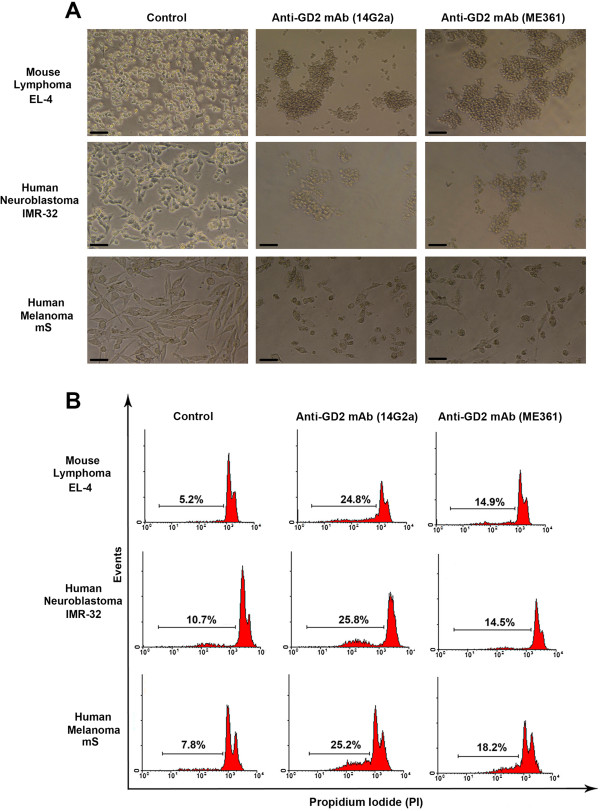
Figure 3.
The cytotoxic effects of two types of anti-GD2 antibodies on GD2-positive tumor cell lines. Phase-contrast images of GD2-positive tumor cell lines EL-4, IMR-32, and mS after 24 h of incubation with or without anti-GD2 mAbs, 14G2a (5 μg/ml) and ME361 (5 μg/ml) are shown in (A). In (A), bar scale: 50 μm. Analysis of DNA fragmentation (PI assay; see Methods) of GD2-positive tumor cells EL-4, IMR-32, mS treated with GD2 mAbs 14G2a (5 μg/ml) and ME361 (5 μg/ml) is shown in (B). In (B), the percentages of the cells with fragmented DNA in hypodiploid peaks are shown for each histogram.

