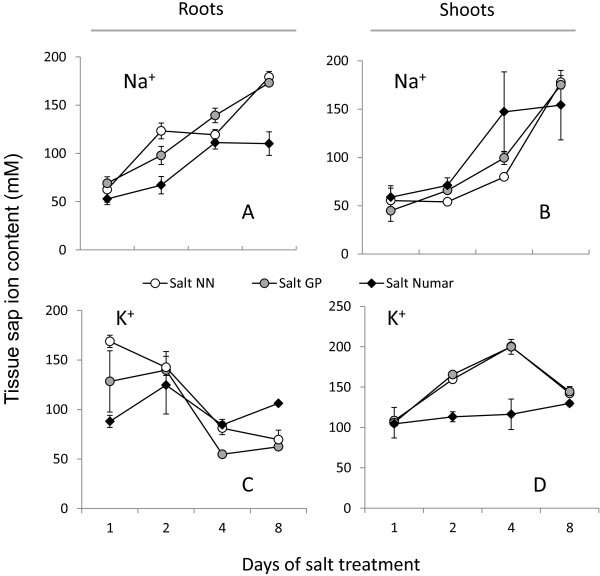
Figure 3.
Changes in root and shoot sap Na+ and K+ content in three barley cultivars contrasting in their salinity stress tolerance during salt stress progression. Plants were grown hydroponically under control conditions until 3 days old, and then exposed to 100 mM NaCl treatment. Mean ± SE (n = 24).

