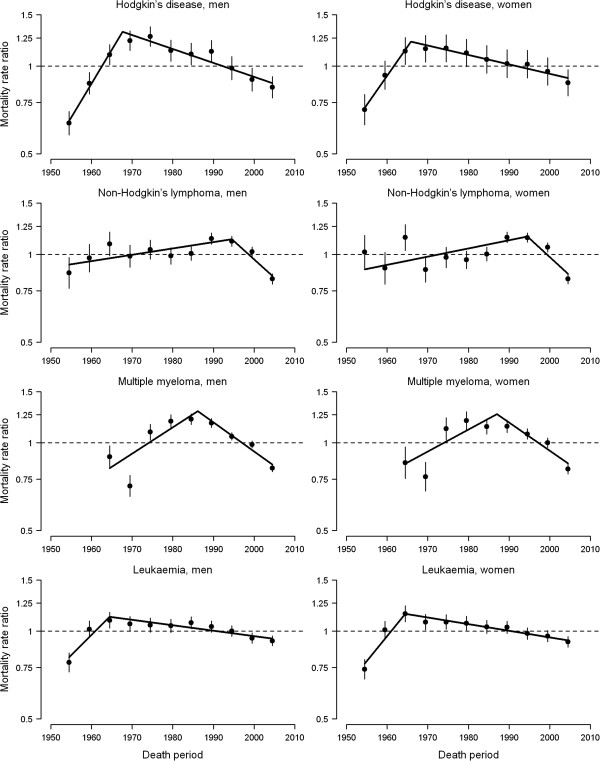
Figure 3.
Curvature in period effect on haematological cancer mortality rates by sex, Spain 1952-2006. The period curvatures and their 95% confidence intervals (vertical bars) were obtained from the three-factor model with the period linear slope removed. Significant trend changes (connected solid segments) were obtained from weighted joinpoint regression analyses of period curvatures.

