
Figure 2.
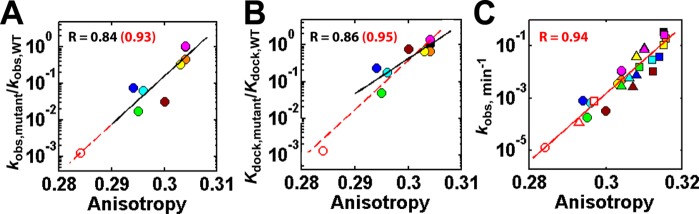
Correlation of ribozyme activity (A, C) and P1 docking (B) with P1 anisotropy. The ratio of the reaction rate (A) or the P1 docking equilibrium constant (B) for each mutant relative to wild type (WT) ribozyme and the reaction rate (C) with additional Mg2+ concentrations included in (C) relative to (A) are plotted against the anisotropy of the P1 duplex in the open complex of the wild type (black) and mutant (MC/MCR, green; P14 (L2), cyan; P14 (L5C), blue; P13 (L2.1), yellow; P13 (L9.1), orange; TL/TLR, magenta; L9/P5, brown; MC/MCR and P14 (L5C) double mutant, red unfilled) ribozymes. The substrate for anisotropy measurement, 5′-r(CCCmUCdCUFUCC)-3′, contains −3m (m; −OCH3) and −1dC (d; −H) modifications to favor the open complex and slow the chemical conversion, respectively;12,19F = 6-MI. The rate constant kobs is the apparent reaction constant for the (E·S)open + UCG → P reaction at 10 μM UCG (subsaturating) using the oligonucleotide substrate, 5′-d(CCCUC)rUd(AAAAA)-3′, which binds primarily in the open complex.19 Reaction conditions: 50 mM NaMOPS, pH 6.9, 30 °C, and varying concentrations of MgCl2 (10 mM, circles; 30 mM, triangles; 100 mM, squares). The same solution conditions were used in FPA measurements. In panel B, the relative P1 docking constant was either from ref (6) (filled) or from smFRET (unfilled; see also Figure 5).