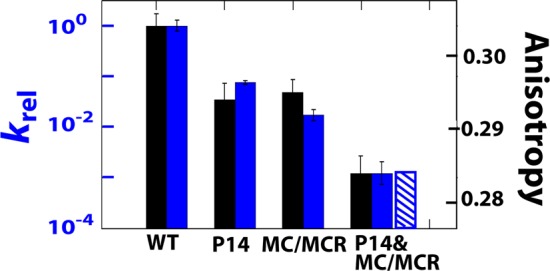
Figure 4.

Reaction rate relative to the WT for the single and double mutants (filled blue bars) and the predicted (hatched blue bar) value for the P14&MC/MCR double mutant for a model in which the two mutations give energetically additive effects. The reaction being followed is (E·S)open + UCG → product (see SI for detailed description). The P1 anisotropy (right axis) is plotted in the black bars. The P14 and P14&MC/MCR constructs are mutated in L5C (Figure 1A).
