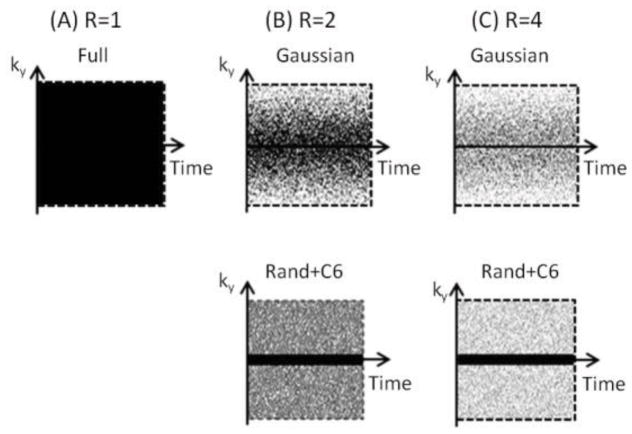
Figure 1.
Different sampling patterns for simulations and experiments. (A) Fully sampled (R=1), (B) undersampled along the PE direction with a reduction factor (R) of 2. The sampling probability follows a Gaussian distribution with sampling of ky = 0 (Gaussian) (top panel) or is constant with the sampling of 6 central lines (Rand+C6) (bottom panel). (C) Same undersampling patterns as in (B) but with R of 4.

