
Figure 2.
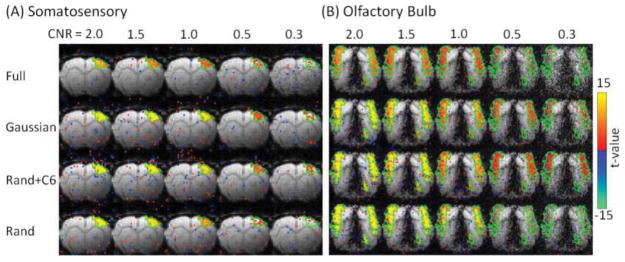
Statistical t-value maps (p<0.01) of S1 and OB calculated from the simulated block-designed fMRI data with different CNR levels. Different rows correspond to different sampling patterns. Green contour: ROI containing the true activation. Color bar: t-value.