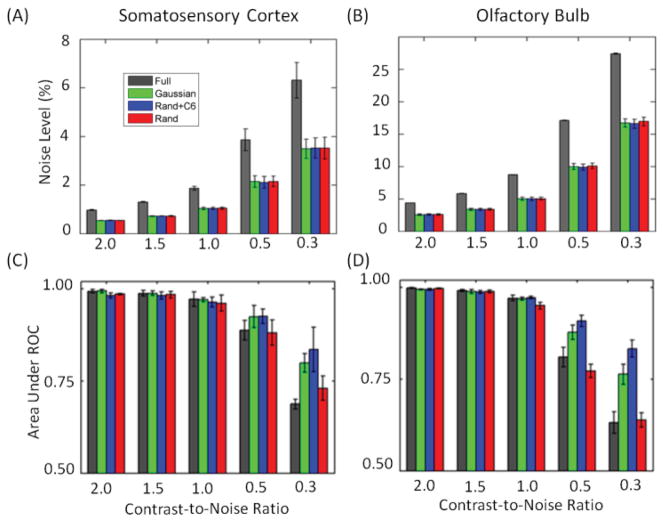
Figure 4.
Baseline noise levels (A–B) and areas under the receiver operator curves for activation detection (C–D) in simulated block-designed data with different CNRs and four sampling patterns (different colors). (A) and (C) for S1 and (B) and (D) for OB. The CS data were reconstructed by k-t FOCUSS with KLT.

