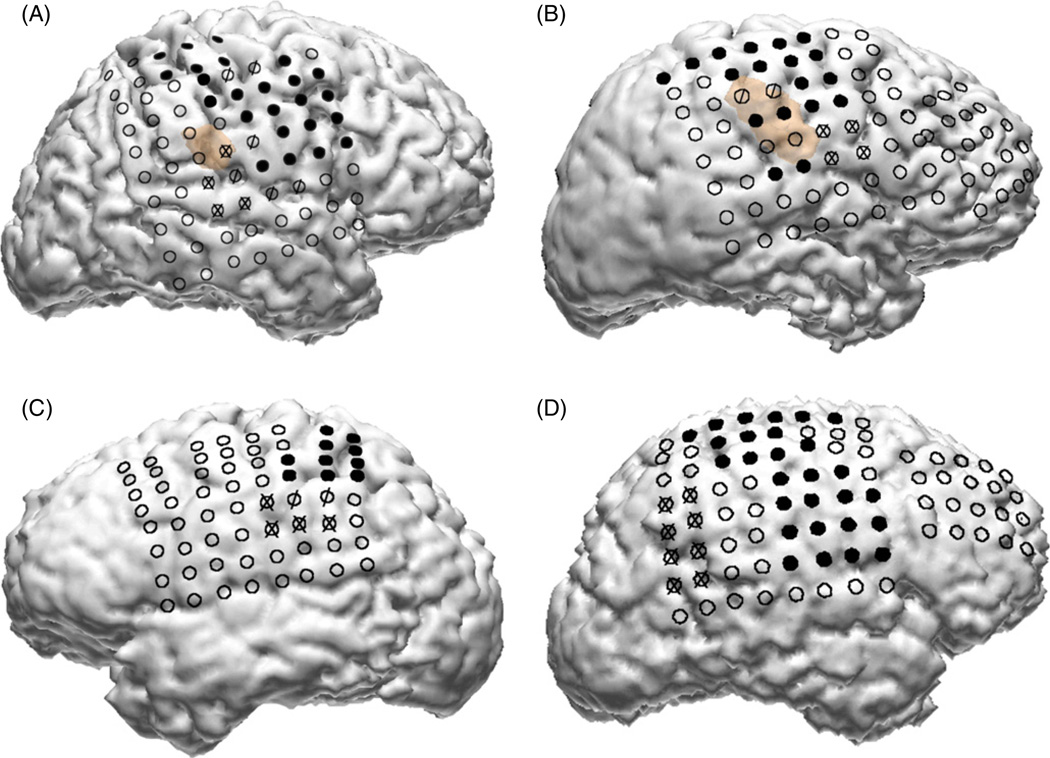
Figure 2.
Locations of ECoG grids in the four subjects. In all subjects some portion of the primary motor, supplementary motor and premotor cortices were covered by the grids. Electrodes depicted in solid black are those for which electrical stimulation mapping (ESM) elicited a primary motor response. Electrodes marked with an ‘X’ are those for which ESM elicited a sensory response. Electrodes marked with a ‘/’ had both motor and sensory responses during ESM. The brown background in subjects A and B depicts the location of cortical dysplasias in these subjects.

