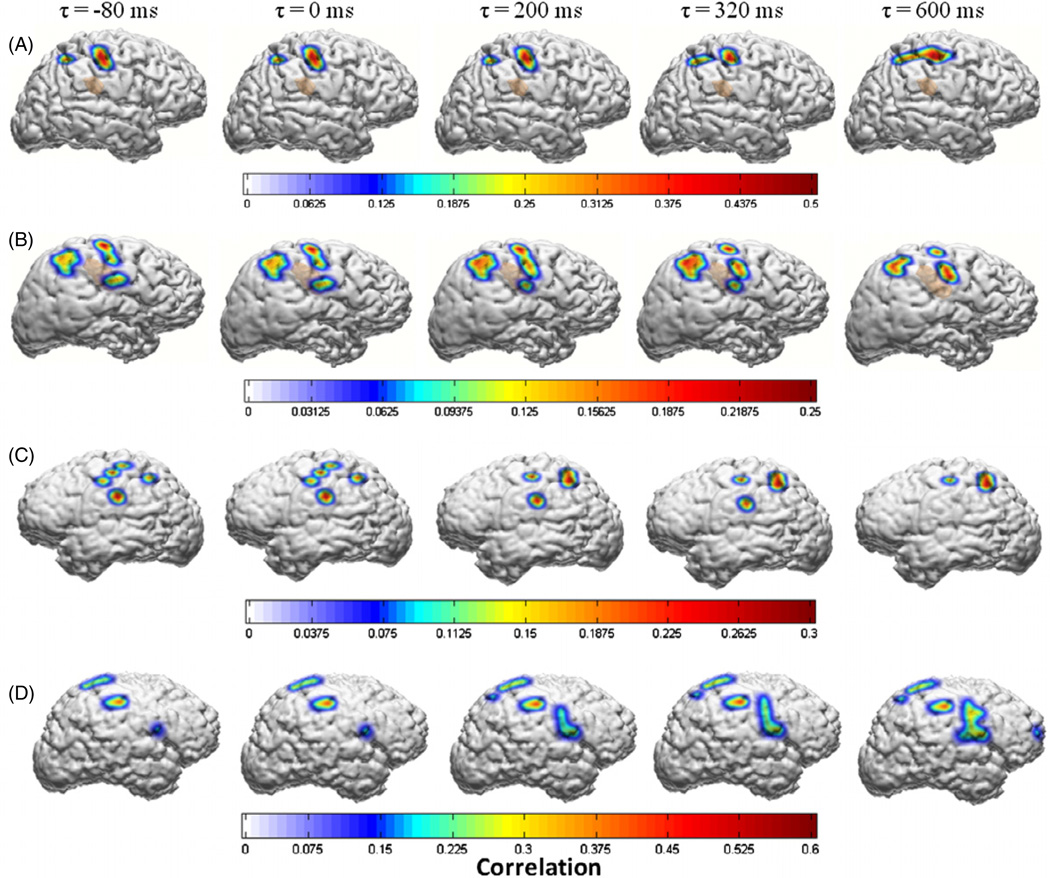
Figure 3.
Spatial distribution of the correlations between the LMPs and the first principal component of finger movements as a function of temporal shift (τ) between the LMPs and the kinematic variable in subjects A, B, C and D, respectively. Only significant values of r (p < 0.01, Bonferroni corrected for multiple pairwise comparisons) are displayed. These figures were generated from a single session of kinematic data (2–3 min) for each subject. For building GLM decoders, subject specific optimal values of ‘τ’ were selected based on the maximal cumulative correlation across all LMPs.

