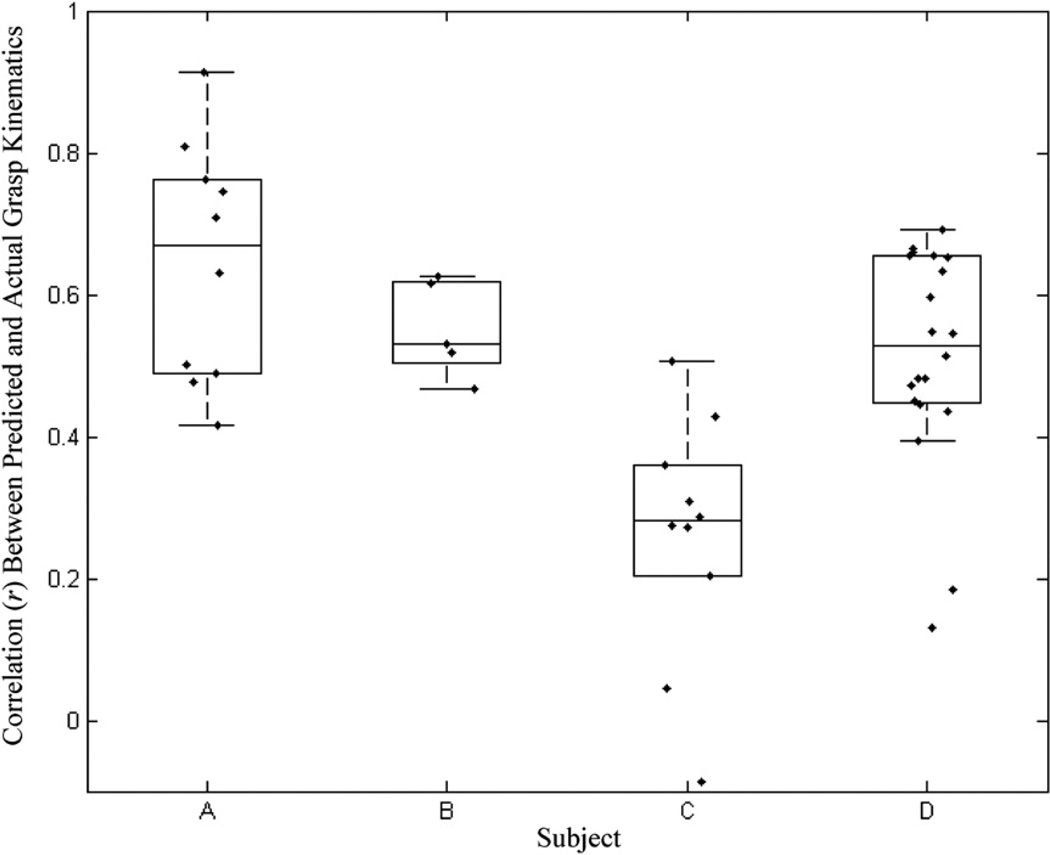
Figure 5.
Summary of decoding performance in four subjects—A, B, C and D—with GLMs trained on data segments from the same session. Each data point represents the correlation (r) between the actual and predicted kinematics of the first principal component of finger movements. The boxplots surrounding the actual data points depict the median decoding correlation. The whiskers represent 1.5 inter-quartile ranges above and below the median.

