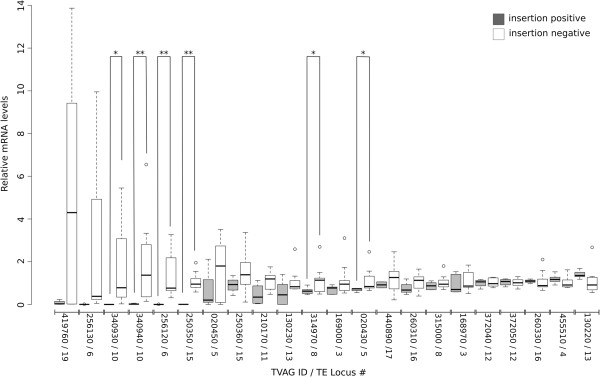
Figure 3.

mRNA levels of genes flanking Tvmar1 loci in insertion positive and insertion negative isolates. Box plot showing relative mRNA levels for 22 genes flanking 13 Tvmar1 loci from insertion positive (grey, left side) and insertion negative (white, right side) isolates. The genes have been ordered by decreasing mean difference in mRNA levels between insertion positive and insertion negative groups. A single asterisk above a box plot pair indicates a P value of <0.05, while a double asterisk indicates a P value <0.01 (Welch Two Sample t-test). The gene examined and its associated Tvmar1 locus is indicated on the x-axis (the tag ‘TVAG’ has been removed due to space constraints). Five outlier data points have been excluded from the insertion positive groups of TVAG_020450, TVAG_256130, TVAG_340930 and TVAG_419760, to allow for higher resolution on the y-axis; however, these outliers are included in the statistical analyses.
